Global trade data can help compare markets or sourcing options, but a fair comparison requires a shared product definition, time window, unit, and reporting basis. The analysis should identify which options merit further research, while keeping regulatory, customer, and operational questions outside the reach of the trade table.
Key takeaways
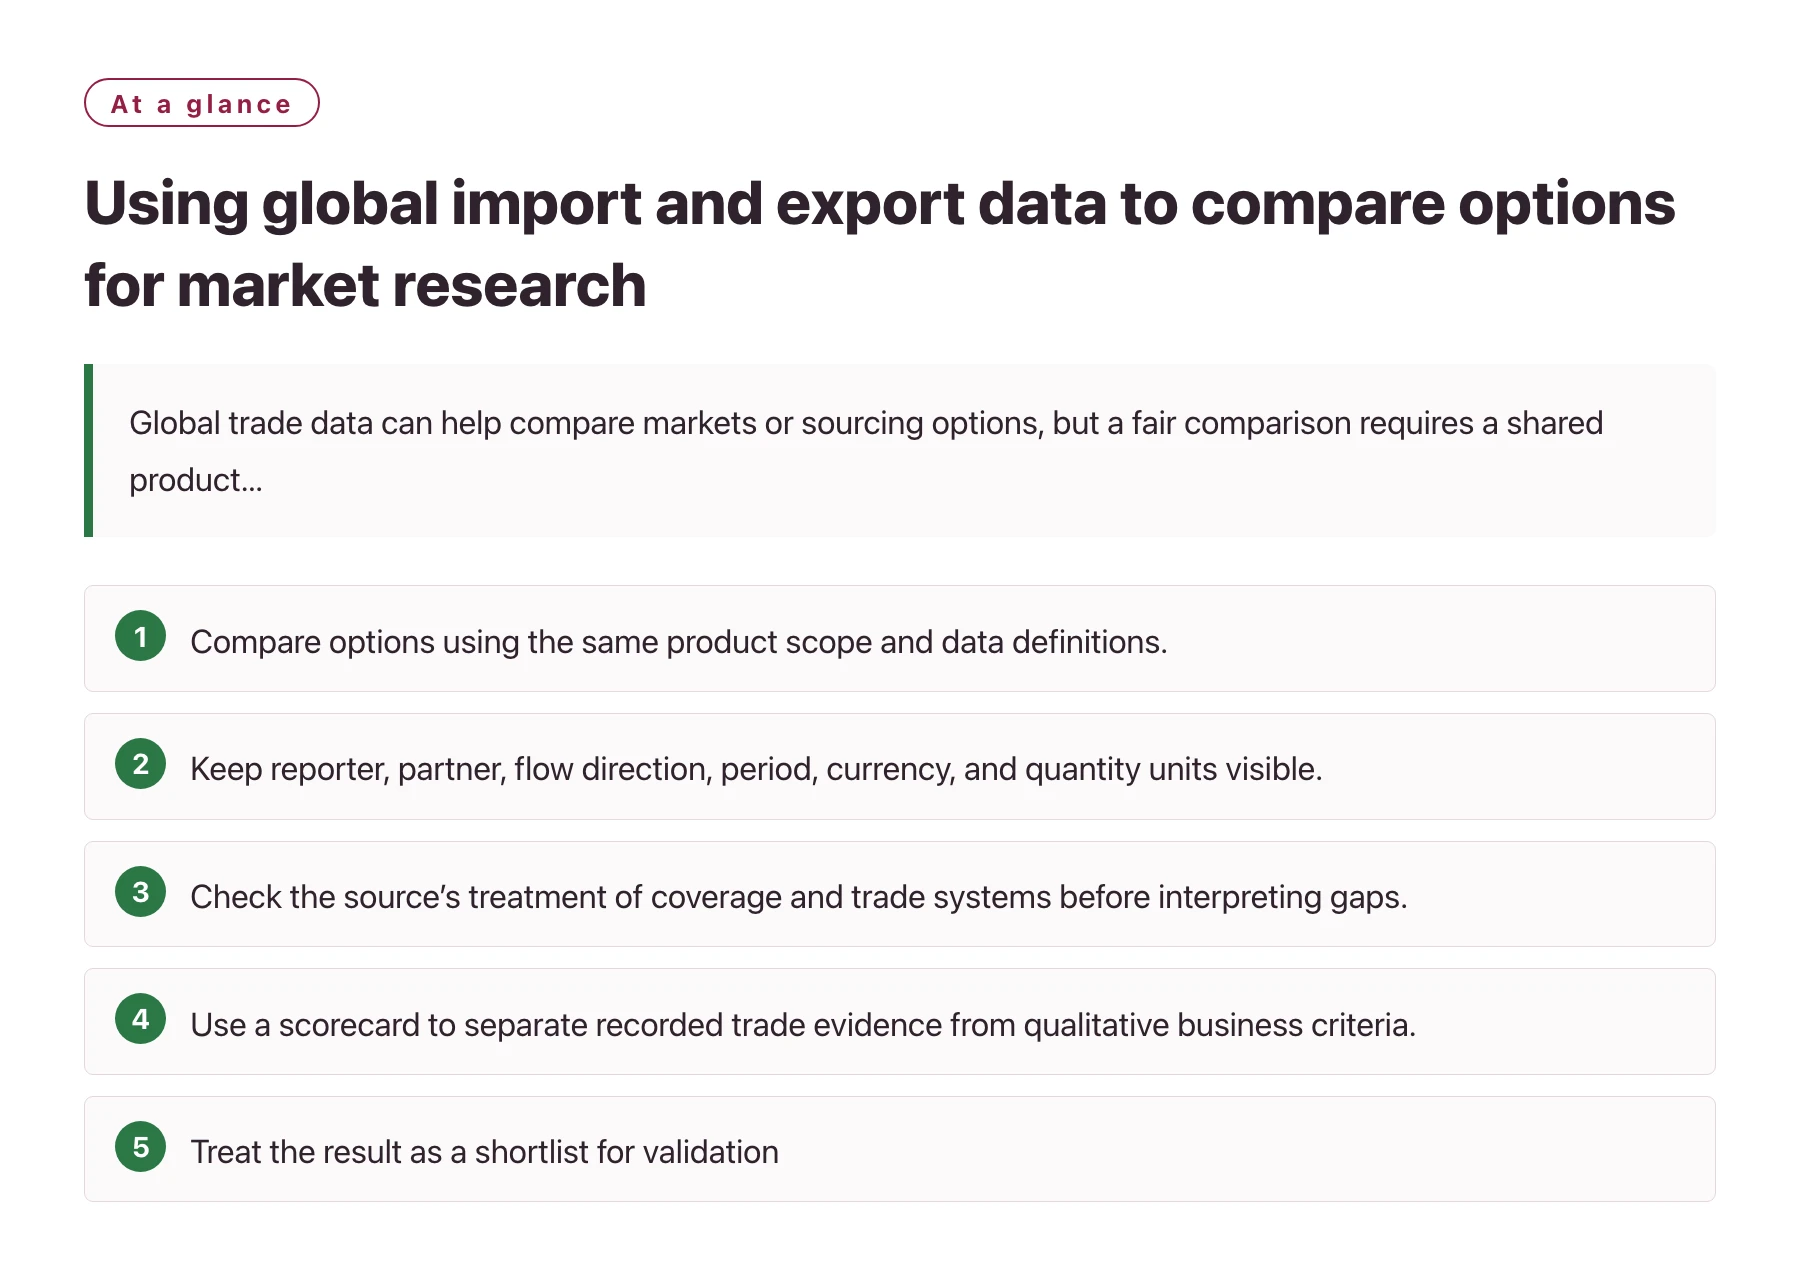
- Compare options using the same product scope and data definitions.
- Keep reporter, partner, flow direction, period, currency, and quantity units visible.
- Check the source’s treatment of coverage and trade systems before interpreting gaps. [1]
- Use a scorecard to separate recorded trade evidence from qualitative business criteria.
- Treat the result as a shortlist for validation, not as a final market decision.
Comparisons are persuasive because they simplify a complex choice. That simplicity can become misleading when the rows in a table were assembled under different definitions. A destination with a higher recorded import value may not be a better commercial choice if its code coverage is broader, its logistics are costly, or the available series measures a different time period.
The framework here is intended for an initial screen. It helps analysts establish comparable trade indicators, make assumptions visible, and route the findings into further research. The goal is not to collapse every factor into one score, but to make the comparison useful without overstating what the data says.
1. Decide what kind of options are being compared
First label the alternatives. Destination markets, supplier countries, products, and individual companies require different data and criteria. A destination screen might compare imports reported by each destination. A supplier screen may compare exports by origin or partner reports. A product comparison may depend on how categories are defined. Avoid putting all alternatives in one table unless they truly share a common unit.
Write the decision and next step above the data. For example, “select up to four destination markets for distributor research” signals that the analysis is a filter, not a full ranking. “Compare suppliers for one material” requires operational and quality evidence that trade totals alone cannot supply.
Choose the candidates before calculating a composite score. If the list changes after an analyst sees the results, record the reason. This protects the comparison from becoming a search for a preferred outcome.
2. Lock a common comparison basis
Use the same product codes, code level, time period, currency, units, and flow direction across options wherever possible. If a local code extension is necessary for one market, mark it as a limitation and avoid presenting it as directly equivalent to a shared international code.
Check definitions for coverage and valuation. A general trade series may include movements that a special trade series excludes. Import values and export values may also be recorded at different border points. The WTO technical notes describe these methodological differences, including the treatment of warehouses and re-exports. A consistent comparison should either harmonize these factors or keep the series separate and explain the difference. [1]
Pick a time window that suits the decision. Use multiple periods to distinguish a durable pattern from an isolated observation. If the series is monthly, consider seasonality and release lag. If annual, ensure each selected year has comparable definitions and note revisions that occurred after an earlier extract.
3. Use a scorecard with separate evidence layers
| Evidence layer | Trade-data indicator | What it can help compare | What still needs checking |
|---|---|---|---|
| Recorded activity | Reported import or export values and quantities | Relative scale within a consistent definition | Price, product mix, coverage, and customer demand |
| Continuity | Observations across multiple periods | Whether the signal appears persistent | Reporting breaks, revisions, and seasonality |
| Concentration | Distribution across partners or companies when available | Whether activity is concentrated or spread | Entity resolution and source coverage |
| Product fit | Codes and descriptions aligned to the offer | Whether records plausibly cover the product | Code ambiguity and technical requirements |
| Commercial feasibility | Not measured by trade totals alone | Which options merit operational review | Tariffs, logistics, regulation, channels, and cost |
Keep the layers visible instead of hiding them in one opaque score. A reader should be able to see where a market advanced and which unresolved question could change its position.
4. Test whether the ordering is robust
If one candidate leads only because of a disputed product code, the ranking is fragile. Run a narrow and a broader defensible product definition and compare the result. Also test whether the ordering changes when using a different start year or an alternate reported flow, where the data supports that check.
Look for outliers and missingness. A single unusually large period can move a candidate above the others. A missing observation may make a market look smaller than it is. Do not fill gaps or smooth outliers without documenting the method and why it is appropriate.
When two sources disagree, investigate their definitions rather than averaging them automatically. Differences can reflect scope, timing, currency conversion, or reporting practice. If the discrepancy cannot be reconciled, present both results and lower confidence in the comparison.
5. Add non-trade criteria after the data screen
Once the trade evidence narrows the field, assess factors that the data cannot answer: product standards, tariff treatment, customer preferences, sales channels, route economics, local competition, and contract or payment conditions. These factors may outweigh the recorded volume. Use a separate assessment so that qualitative judgments are not mistaken for statistical observations.
For company-level alternatives, verify the legal entity, current operations, product capabilities, and relationship to the recorded activity. A company appearing in a data source may be a broker, affiliate, or differently named entity. Use independent company information and direct checks before putting it into an outreach plan.
When searchable cross-border records help with the next step, TradeData Pro may be evaluated as a research resource. Compare its country coverage, fields, sample outputs, and update timing with the needs of the specific options under review. A platform’s broad coverage is only useful when the relevant detail is available for the exact comparison.
6. Present a shortlist with confidence, not false precision
Summarize the comparison with the question, common basis, data sources, retrieval date, and the main result. Use plain labels such as “advance for validation,” “hold pending classification review,” or “not comparable with current data.” Avoid implying that a top-ranked option is the best market unless the research included the other factors required to make that judgment.
Assign confidence based on evidence quality. Confidence can be lower when data is missing, classification is broad, definitions differ, or the selected period contains a break. State which new evidence would raise or lower confidence. This makes the recommendation actionable and gives the team a clear route to resolving uncertainty.
End with a next step for each shortlisted option. One may need distributor interviews, another tariff review, and a third company identity checks. A useful comparison does more than order rows; it helps the business decide where to spend its next unit of research effort.
Sources
Frequently asked questions
Can trade data identify the best market?
It can help screen and compare recorded activity, but a final market decision also requires customer, regulatory, logistical, competitive, and operational evidence.
How can analysts make market comparisons fair?
Use a consistent product scope, code level, period, currency, unit, flow direction, and reporting basis, and disclose remaining differences.
Should all comparison criteria be combined into one score?
Not by default. Keeping quantitative trade evidence and qualitative commercial factors separate makes assumptions easier to review.
What if the ranking changes with different product codes?
Show the sensitivity, explain the classification choices, and lower confidence until the product mapping is clarified.